


Workforce
State, Defense departments announce deal to expand military spouse access to remote work jobs
The move to allow federal employees to telework while overseas with their service member spouses is part of a larger effort to boost recruitment of military spouses.
Management
GSA lacks management controls for keeping foreign gifts, IG says
An inspector general’s audit of the agency’s Foreign Gifts and Decorations Program found that GSA officials were missing gifts from its inventory while also possessing prohibited items due to insufficient management practices.
Management
FEMA is making an example of this Florida boomtown. Locals call it ‘revenge politics’
The Biden administration is trying to punish Lee County for rebuilding flood-prone homes. The state’s Republican politicians are fighting back.
Management
Senate Veterans’ Affairs chair calls for more mental health care providers in rural areas
Sen. Jon Tester, D-Mont., asked VA Secretary Denis McDonough to increase the number of providers and ensure they are “in locations where veterans need them most.”
Sponsor Content
Modernizing public health care
Discover how Optum Serve helped leading federal agencies address systemic problems and improve community health and well-being efficiently, effectively and sustainably.


Management
BLM to finalize rule allowing federal leases targeted at protection of natural areas
The rule marks a shift in the agency’s focus toward conservation.
Management
Biden administration to roll back the Betsy DeVos Title IX rules
New Education Department regulations would undo Trump administration changes to sexual discrimination policies at U.S. colleges and universities, now requiring the schools to have in place measures to offer support to students and employees alleging discrimination.


Pay & Benefits
OPM has new tools to fight improper health insurance enrollments
Watchdog agencies and Congress have previously chided the federal government’s HR agency for the lack of internal controls ensuring that family members of federal workers and retirees remain eligible for the federal workforce’s health insurance program.
Sponsor Content
Navigating the AI revolution: Strategies for ethical implementation in federal civilian agencies
An industry expert offers an insightful demystification of AI, delving into core principles and best practices the company infuses into service, as well as advice for an ever-changing future.


Pay & Benefits
Justice Department outlines benefits rule for Havana syndrome victims
A new interim final rule details how the department would compensate employees and dependents with qualifying brain injuries from anomalous health incidents.
FEATURED INSIGHTS


Management
IRS commissioner indicates AI will play growing role in future tax collection
IRS Commissioner Danny Werfel opined about the agency’s current and future use of AI just days after Tax Day.


Tech
TSA looks to AI to enhance x-ray screenings of travelers’ luggage
The Transportation Security Administration is already using facial recognition to verify the identity of travelers but wants to improve its scanners to detect more prohibited items.


Workforce
Pekoske touts impact of pay increases at TSA budget hearing
Workforce attrition has halved since the implementation of a new pay system that mirrors the General Schedule, while employee morale has reached its highest ever, according to the annual Federal Employee Viewpoint Survey.
TSP TICKER
FUND
G
F
C
S
I
APR 22 CLOSE
$18.1989
$18.6517
$78.4464
$76.8395
$41.0367
DAILY CHANGE
0.0064
0.0097
0.6789
0.7717
0.4983
THIS MONTH (%)
0.26
-2.24
-4.58
-6.78
-3.61
FUND
L 2060
L 2050
L 2040
L 2030
L INCOME
APR 22 CLOSE
$15.6476
$31.4721
$52.5513
$46.3414
$25.3207
DAILY CHANGE
0.1560
0.2617
0.3859
0.2878
0.0727
THIS MONTH (%)
-4.51
-3.85
-3.37
-2.78
-1.13
FUND
APR 22
CLOSE
CLOSE
DAILY
CHANGE
CHANGE
THIS
MONTH
MONTH
G
$18.1989
0.0064
0.26
F
$18.6517
0.0097
-2.24
C
$78.4464
0.6789
-4.58
S
$76.8395
0.7717
-6.78
I
$41.0367
0.4983
-3.61
L 2050
$31.4721
0.2617
-3.85
L 2040
$52.5513
0.3859
-3.37
L 2030
$46.3414
0.2878
-2.78
L 2020
$None
None
L INCOME
$25.3207
0.0727
-1.13


Pay & Benefits
Postponing retirement problems: Part 1
It’s important to know the difference between a postponed retirement and a deferred retirement.
Workforce
New bill would create federal grant program for digital upskilling
The proposed Digital Skills for Today’s Workforce Act would add digital skills training to grant programs that provide education and professional development services in an effort to boost the talent pipeline.


Oversight
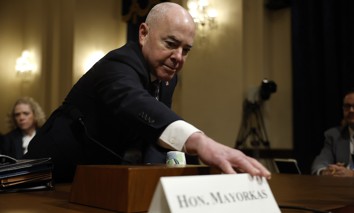
Senate rejects impeachment articles against DHS Secretary Mayorkas
In a 51-49 vote along party lines, Senate Democrats dismissed impeachment charges Wednesday against Homeland Security Secretary Alejandro Mayorkas for not meeting the threshold of high crimes and misdemeanors.
Oversight
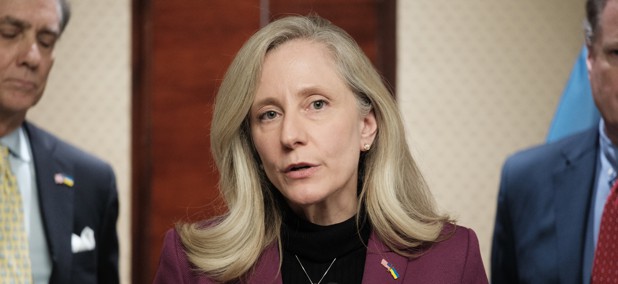
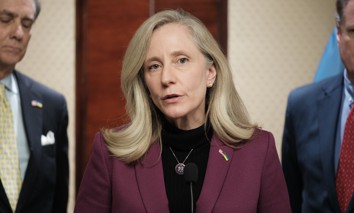
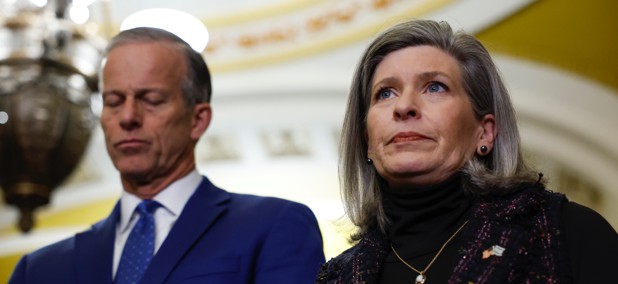
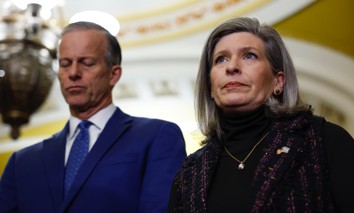
When -- and how often -- are SBA staffers going into the office? A senator wants the agency's IG to find out
Sen. Joni Ernst, R-Iowa, continued her criticism of federal agencies’ use of telework, calling for the Small Business Administration’s inspector general to investigate its office utilization rates after its administrator disputed the GAO’s findings.

Management
Biden’s FLRA nominees move closer to Senate confirmation
Senators appeared poised Wednesday to advance the nominations of aspiring leaders in labor-relations.


Tech
NIST adds 5 new members to its AI Safety Institute
The new members will focus on AI objectives related to national security, standards development and more.


Pay & Benefits
Estate planning for federal employees: Maximize benefits and minimize taxes
Make sure to review and update your estate plan regularly to reflect changes in your financial situation and personal circumstances.


Tech
Feds move to make gov websites more accessible to people with disabilities
It’s the first time the federal government has ever issued rules clarifying how the more than 30-year-old Americans with Disabilities Act applies online. But the new rules come with a hefty price tag for state and local governments.

Management
Texas Republicans urge Senate Democrats to give the DHS secretary a full impeachment trial
The House voted to impeach Alejandro Mayorkas on Feb. 13 over charges of refusing to enforce the law and “breach of public trust.”


Tech
100,000 have used IRS Direct File to submit their tax returns
The agency has not yet determined whether the pilot program for the tool will be extended into a permanent offering.


Management
OPM Director will leave the Biden administration
Kiran Ahuja oversaw efforts to transform the federal government’s HR agency into a government-wide leader on human capital policy, issuing new policies governing interns, telework and civil service protections.


Pay & Benefits